New Report Ranks the Rate of Disconnected Youth in the U.S.

Posted October 24, 2013 by chiyouthjustice
Categories: Facts and Statistics, New Research

Measure of America released a report (PDF) this week that “that ranks the 25 most populous U.S. metro areas by the share of young adults between the ages of 16 and 24 who are neither working nor in school.” The report titled “Halve the Gap by 2030: Youth Disconnection in America’s Cities” was co-authored by Sarah Burd-Sharps and Kristen Lewis.

According to the report, nearly 6 million young people (or 1 in 7) are disconnected. According to the study:

“Disconnected youth are people between the ages of 16 and 24 who are neither in school nor working. Young people in this age range who are working or in school part-time or who are in the military are not considered disconnected. Youth disconnection rates in this report are calculated by Measure of America using employment and enrollment data from the 2011 American Community Survey (ACS) of the US Census Bureau.”

Some of the key national findings from the study are as follows:

· More than one in every seven young people in America — 5.8 million teens and young adults between the ages of 16 and 24— is unemployed and not enrolled in school.

· The lowest rates of youth disconnection among the 25 most populated cities are found in Boston (9.2 percent), Minneapolis (9.5 percent), and Washington, DC (11.3 percent).

· The highest rates of youth disconnection among the 25 most populated cities are found in San Bernardino (18.8 percent), Detroit (17.4 percent), and Charlotte (17.3 percent).

· The greatest differences in youth disconnection rates are found within cities as opposed to between cities. In Chicago, New York, and Detroit, gaps of approximately 30 percentage points separate neighborhoods within the same city.

· Major differences in youth disconnection rates also exist based on race and ethnicity. In Pittsburgh and St. Louis, one in every four African American youths is disconnected, compared to one in every ten white youths. Nationwide, African Americans are about three times as likely as Asian Americans and twice as likely as whites to be disconnected in their teens and early twenties.

Some of the findings specific to the Chicago metro area are as follows:
[Please note that the Chicago metro area includes: Cook, DeKalb, DuPage,
Grundy, Kane, Kendall, McHenry, Will, and Lake Counties in Illinois;
Jasper, Lake, Newton, and Porter Counties in Indiana; and Kenosha
County in Wisconsin.]

. The rate of youth disconnection in Chicago is 14.1 percent ranking 9th best
among the 25 most populated cities. That’s a total of 166,047 young people.
In Chicago, 24.9% of African American youth 16 to 24 is disconnected while 15.6% of Latino youth and 9.2% of white youth are.

. Chicago registers a 15.7 percentage point gap between whites and African
Americans, the third-largest gap among all of the cities.

. In Chicago, Lake View and Lincoln Park have a youth disconnection rate of 2.9%, compared to South Lawndale and the Lower West Side with a rate of 33.2%.

. In Chicago, youth disconnection rates among the major racial and ethnic groups differ considerably from national averages. Both Latinos and whites in Chicago are more likely to have positive outcomes in terms of youth connection than their national counterparts. On the other hand, African Americans in Chicago have worse outcomes than African Americans nationally. Chicago African Americans have the third highest rate of disconnection after Detroit and Philadelphia. One in four African Americans is disconnected, more than two and a half times higher than the rate of their white neighbors. Latinos are at the other end of the spectrum. Only San Francisco and Washington, DC have better outcomes for Latinos. As a result of these extremes, Chicago has one of the highest gaps by race and ethnicity. Nearly sixteen percentage points separate African Americans and whites, the third highest gap after New York and Philadelphia.

.

Fact Sheet: Youth School-Based Arrests at Chicago Public Schools (2012)

Posted October 1, 2013 by chiyouthjustice
Categories: Arrests, Chicago Police Department, Chicago Public Schools, Facts and Statistics

Special thanks to our supporter Jacqui Shine for designing this fact sheet based on our most recent data report about school-based arrests on CPS properties.

arrests-FS-1-page-001

You can download a PDF of the fact sheet HERE.

Memes Based on CPS School-Based Youth Arrest Report

Posted September 30, 2013 by chiyouthjustice
Categories: Arrests, Chicago Police Department, Chicago Public Schools, Facts and Statistics

Our friends at the Native Youth Sexual Health Network created some memes for us based on findings from our recent report “Policing Chicago Public Schools 2” about youth arrests on CPS properties (2011 & 2012). We have been using the memes on social media to raise awareness during the National Week of Action Against School Pushout.

Slide2(1)

Slide1(2)

Slide4

Infographic: Juvenile Incarceration in the U.S.

Posted September 18, 2013 by chiyouthjustice
Categories: Facts and Statistics, Infographic, Youth Incarceration

PSPP_juvenile_graphic(v2)

From the Pew Charitable Trusts:

Between 2010 and 2011, the number of committed youth—those locked up as a result of a court-ordered sanction—fell in 43 states, according to the most recent data released by the federal Office of Juvenile Justice and Delinquency Prevention. The juvenile commitment rate dropped 14 percent during that period. In 2011, almost 42,000 committed youth were held on any given day in a juvenile corrections facility or other residential placement. This represents 1 in 751 youth across the United States.

Infographic: Cook County Detention Center Admissions (July 2012-June 2013)

Posted September 1, 2013 by chiyouthjustice
Categories: Cook County Juvenile Temporary Detention, Facts and Statistics, Infographic

Check out our new infographic. The graphic illustrates detention population data reported by the Juvenile Temporary Detention Center (JTDC) for the period starting on July 1, 2012 and ending on June 30, 2013.

Infographic: FY2012 Admissions to the Department of Juvenile Justice (Youth Prison System)

Posted August 21, 2013 by chiyouthjustice
Categories: Facts and Statistics, Illinois Department of Juvenile Justice, Youth Incarceration

Check out this great interactive infographic that our friend and volunteer Eva Nagao created to share data about FY2012 admissions to the Department of Juvenile Justice.

New Paper: Alternatives to Youth Incarceration in Chicago

Posted August 19, 2013 by chiyouthjustice
Categories: Cook County Juvenile Temporary Detention, Illinois Department of Juvenile Justice, New Research, Youth Incarceration

“WE’RE IN IT FOR THE LONG HAUL:”
ALTERNATIVES TO INCARCERATION FOR YOUTH IN CONFLICT WITH THE LAW

There is an urgent need to find constructive ways to respond to young people in conflict with the law. Research compellingly demonstrates that youth placed in juvenile detention centers compared to alternative interventions are much more likely to later spend significant time in prison (Aizer and Doyle, 2013). Juvenile and adult incarceration both create exorbitant financial and social costs (Petteruti, Velázquez, and Walsh, 2009). Incarceration of juveniles is harmful to young peoples’ development, education, families, communities, and their current and future socioeconomic status (Majd, 2011; Bickel, 2010). Furthermore, incarcerating youth is not effective at enhancing public safety (Butts & Evans, 2011; Petteruti, Velázquez, & Walsh, 2009).

In Chicago, a group of individuals and organizations are working to address the needs of young people who others have mostly given up on. Behind the headlines of gang violence, shootings, and despair, there is an untold and unheralded story of perseverance, tenacity, and hope in communities across the city. Every single day, there are individuals representing various community-based organizations in Chicago who are called to meet the needs of youth in conflict with the law. They do so with shockingly few resources, mostly out of the public eye, and always with a determination that all young people deserve love and support.

prison In the United States, over 2.2 million people are incarcerated in prisons and jails. To some, the country has become a “Prison Nation.” Young people have not escaped the historical trend of increasing criminalization. As a way to decrease the numbers of people behind bars, states have turned to alternatives to incarceration.

Today, Project NIA is pleased to release a paper written by Michelle VanNatta and Mariame Kaba which specifically addresses five programs in Chicago that provide alternatives to incarceration for young people charged with or convicted of crimes. Included in this exploration are issues of cost, effectiveness, capacity, and the needs of youth and organizations moving forward.

At their core, the interventions and programs that are highlighted in this paper privilege relationship-building above everything else. This will not be satisfying for those who seek a quick-fix to address the needs of youth in conflict with the law. The organizations and programs featured define success based on whether they have been able to connect young people with a person who will walk with them through a perilous road littered with pitfalls and danger.

These aren’t programs that operate from 9 to 5 p.m. on Mondays through Fridays. The staff don’t necessarily hold advanced degrees and most are paid at near minimum wage rates. When asked about their program budgets, most directors smile while suggesting that they made due with very limited funds. Most of the programs are housed in and/or run by faith-based institutions like churches.

In the end, we hope that those who read the paper will come away with a better understanding of the challenges and the promise of current “alternative to incarceration” programs in Chicago. As the value of these programs becomes clear, we also hope that funders and community members will direct more resources to them.

The paper can be downloaded HERE (PDF).

Special thanks to Matt DeMateo, Father Dave Kelly, Heidi Mueller, Cliff Nellis, Ethan Ucker for taking the time to talk with us about their work. Thanks also to our friend Caitlin Seidler for donating her time to design the paper.

Please direct any questions or comments about this paper to Michelle VanNatta and Mariame Kaba at projectnia@hotmail.com.

Also, Join us on September 26th for an event that addresses the issues raised in this paper. Space is very limited. We will not be accepting any walk-ins. You must pre-register. Information is HERE.

Finally, a few months ago, Leah Varjacques created a video story featuring two of the programs featured in the paper: Circles & Ciphers and Precious Blood Ministry of Reconciliation.

restoring hope from Leah Varjacques on Vimeo.

Juvenile Arrests in Chicago – Key Findings from Two New Reports

Posted August 5, 2013 by chiyouthjustice
Categories: Arrests, Chicago Police Department, Facts and Statistics

Over the past few months, Project NIA has been working on several reports about juvenile arrests in Chicago. In May, we released a second edition of our Policing Chicago Public Schools report that focused on data about school based arrests in 2011 & 2012.

Today, we are releasing two reports.

The first focuses on trends in Chicago juvenile arrests from 2009 to 2012. It was written by Ashley Cook, Zygmunt Czykieta, Paul Mack, and Chris Skrable (with contributions by Mariame Kaba). Ashley, Ziggy, Paul and Chris undertook this research as part of an Introduction to GIS course taught by Dr. Mike Stiehl at Loyola University this spring. You can download the report HERE.

The second report is an updated version of our Arresting Justice report that we published in 2011. The new report focuses on Chicago juvenile arrests in 2011 & 2012. You can download it HERE.

Below is a summary of the key findings from both reports. We hope that you find this data useful as you work to decrease young people’s contact with the police.

Juvenile Arrests in Chicago (2012) – Key Findings at a Glance… by Mariame Kaba, Project NIA

  1. According to the Chicago Police Department (CPD), there were 22,877 arrests of youth 17 and under in 2012 (some youth may be arrested more than once). This represents a nearly 27% decline in juvenile arrests since 2009. (Arresting Justice 2, 8/13)
  2.  In 2012, black youth accounted for 79% of juvenile arrests in Chicago (Arresting Justice 2, 8/13)
  3. Expressed in per capita rates, in 2012, black youth were arrested 7.6 times per 100 youth, five times more frequently than Hispanic youth (1.5 arrests per 100 youth) and TEN times more frequently than white youth (0.7 arrests per 100 youth). (Cook, Czykieta, Mack,  Skrable, & Kaba 8/13)
  4. For the first time, we present a district by district breakdown of percentages of specific racial populations compared to the percentage of arrests constituted by members of that racial group.

Racial Breakdown of Percentage of Youth & Arrests by District (2012)

District

% Black Youth

Black % of Youth Arrests

% White Youth

White % of Youth Arrests

% Hispanic Youth

Hispanic % of Youth Arrests

1

32.70%

89.50%

35.10%

2.50%

9.01%

6.84%

2

81.60%

96.90%

8.25%

0.68%

3.48%

1.45%

3

94.40%

99.30%

1.10%

0.30%

2.05%

0.22%

4

59.90%

86.10%

3.28%

1.22%

35.40%

12.10%

5

95%

98.90%

0.32%

0.31%

3.95%

0.77%

6

97.10%

99.50%

0.19%

0.08%

1.51%

0.15%

7

96.70%

99.90%

0.14%

0.07%

1.92%

0.07%

8

19.90%

59.60%

9.23%

4.83%

69.40%

35.20%

9

12.80%

52.90%

6.63%

6.12%

69.50%

40.50%

10

29.50%

61.60%

0.92%

1.05%

69.10%

37.10%

11

84.80%

98.10%

0.93%

0.22%

12.90%

1.49%

12

23.30%

52%

11.30%

1.57%

59.40%

46.30%

13

25.10%

70.50%

24.50%

3.41%

36.50%

26.10%

14

10.60%

35.10%

18.90%

6.44%

66.50%

57.80%

15

93%

99.50%

0.71%

0.14%

4.93%

0.41%

16

1.10%

17.50%

55.40%

39.50%

35.10%

40.80%

17

3.48%

28%

25.80%

13.10%

57.70%

57.30%

18

21.10%

91.50%

60.10%

2.58%

7.01%

4.94%

19

11.80%

60.50%

61.70%

14.80%

16.30%

23.50%

20

12.90%

69.80%

34.80%

0%

32.20%

29.40%

22

60.50%

95%

32.40%

3.61%

5.19%

1.29%

24

20.40%

70.70%

27.20%

4.41%

32.10%

22.50%

25

15.40%

46.80%

6.07%

4%

76.50%

48.80%

Black youth are arrested in greater proportion than their populations represent throughout the entire city. Hispanic youth are arrested in greater proportions in a few districts on the Northside and white youth are arrested in smaller proportions than their population throughout the entire city. (Cook, Czykieta, Mack, Skrable, & Kaba, 8/13)

5. In Chicago, boys/young men were 84% of juvenile arrests in 2012 (Arresting Justice 2, 8/13).

6. More juvenile arrests in Chicago were for misdemeanor offenses (74%) in 2012 (Arresting Justice 2, 8/13).

7. In 2012, most of the juvenile arrests (64.5%) in Chicago were concentrated in 10 districts. In order of most arrests, these districts are 8, 11, 7, 15, 4, 3, 6, 5, 9, and 10 (Arresting Justice 2, 8/13).

8. There were 1,080 formal and 6,149 informal stations adjustments[1] reported by the Chicago Police Department in 2012 (Arresting Justice 2, 8/13)

Sources:

Kaba, Mariame (2013) Arresting Justice (Second Edition): Juvenile Arrests in Chicago, 2011 and 2012.

Cook, Czykieta, Mack, Skrable & Kaba (2013) Trends in Chicago Juvenile Arrests, 2009-2012.


[1] As an alternative to referring the case to Juvenile Court, a youth officer may release a young person from custody with a station adjustment. There are two types of station adjustments: informal and formal. A youth officer may give an informal station adjustment if he/she decides there is probable cause to believe the juvenile committed an offense. A formal station adjustment is different in that a juvenile must also admit involvement in the alleged offense. The juvenile’s admission can later be used as evidence against him/her if they violate the terms of the formal adjustment and his case is referred to court.

Although they are not convictions, station adjustments usually appear in a juvenile’s arrest history. All formal station adjustments must be recorded with the Illinois State Police. Informal station adjustments for felonies must also be recorded with the Illinois State Police, and informal station adjustments for misdemeanors may be recorded. Station adjustments can be expunged from a juvenile’s record.

A Comeback for Kids: Illinois a National Leader in Reducing Number of Youth in Confinement

Posted June 18, 2013 by chiyouthjustice
Categories: Facts and Statistics, Illinois Department of Juvenile Justice, New Research, Youth Incarceration

New national report (PDF) showcases how state improved conditions for kids and communities through key juvenile justice policy reforms

CHICAGO – The number of youth confined in Illinois state and county facilities (public and private) declined by 38 percent from 2001 to 2010, according to a new report, “Comeback States,” released today by the National Juvenile Justice Network (NJJN) and the Texas Public Policy Foundation’s Center for Effective Justice (TPPF).

The report found that youth confinement in public facilities in Illinois peaked at 3,074, in 2000, up from 1,534 in 1985. By 2010, however, Illinois’ confined youth population was reduced to 1,949 in public facilities, and the state’s youth incarceration rate overall declined to 119 confined youth for every 100,000 young people (age 10-to-16 years old) in the state’s population.

“In Illinois, there is a growing recognition that incarcerating children must be a last resort chosen only after all less restrictive options have been exhausted,” said Elizabeth Clarke, President of the Juvenile Justice Initiative, a member of NJJN. “Local leaders know that kids coming out of prison too often return to prison and that rehabilitation services delivered in their home communities are much more effective and cost less than the nearly $90,000 annual cost of sending a child to a state prison.”

For youth being held in detention centers awaiting trial or incarcerated in juvenile facilities, this is a critical change. Youth who are locked up are separated from their families, many witness violence, and struggle when they get out, trying to complete high school, get jobs or go to college. Aside from the human toll, the financial costs of maintaining large secure facilities have also made it critical to rethink juvenile justice in every community.

For youth being held in detention centers awaiting trial or incarcerated in juvenile facilities, this is a critical change. Youth who are locked up are separated from their families, many witness violence, and struggle when they get out, trying to complete high school, get jobs or go to college. Aside from the human toll, the financial costs of maintaining large secure facilities have also made it critical to rethink juvenile justice in every community.

The report argues that the turnaround can be broadened by changes to state policy like those made in the comeback states that reflected declines in youth crime, new understandings of the teenage brain and adolescent development, availability of less costly, evidence-based alternatives to incarceration, and constrained state budgets. These policy reforms include:

  • Increasing the availability of evidence-based alternatives to confinement;
  • Requiring intake procedures that reduce the use of detention facilities;
  • Closing or downsizing youth confinement facilities;
  • Reducing schools’ overreliance on the justice system to address discipline issues;
  • Disallowing incarceration for minor offenses; and
  • Restructuring juvenile justice responsibilities and finances among states and counties.

NJJN and TPPF identified these six policies as key measures of positive reform – five of which were adopted by Illinois – because they all encourage reduced reliance on detention and incarceration across the U.S.

“The policy reforms adopted by these Comeback States reflect a new approach to addressing youth incarceration in the nation,” said Marc Levin, Director of the Center for Effective Justice at TPPF. “States should continue to look to innovative policy changes that emphasize rehabilitation over youth incarceration in order to create safer communities while also reducing the huge societal and economic costs of youth confinement.”

comebackstates

The Comeback States highlighted in the report were selected because they adopted at least two-thirds of the policy changes the report focused on, exceeded the national-average reduction in youth confinement between 2001 and 2010, and experienced a decline in youth arrests during the same period. States that met this threshold included: California, Connecticut, Illinois, Ohio, New York, Mississippi, Texas, Washington, and Wisconsin.

In addition to the advances made in these states, the United States also saw remarkable improvement in reducing youth confinement overall. According to the report, the number of confined American youth reached a record 108,802 in 2000, driven by an increase in youth arrests, public concern regarding youth crime, and tough state policies favoring incarceration. In the decade that followed, however, youth confinement in U.S. dropped by 39 percent – a dramatic turnaround that virtually erased the spike in youth incarceration that began in the 1985 and peaked in 2000.

“States have made strides in changing their policies so that youth are held accountable in age appropriate ways, but there is more work to be done,” said Sarah Bryer, Director of NJJN. “It is critical that we build upon the success seen over the past twenty years and make every effort possible to adopt meaningful reforms that reduce youth confinement and strengthen our communities.”

Despite the turnaround seen nationwide and in the Comeback States, NJJN and TPPF caution that the high cost of youth incarceration to taxpayers and society, the infrequent use of cost-effective alternatives to youth incarceration, and the high level of youth confined for non-serious offenses, remain a serious cause of concern.

In Illinois, juvenile justice groups aren’t resting on their laurels either.

“Although Illinois is on the right track, we have more work to do to ensure that every child in conflict with the law has access to community based alternatives through programs like Redeploy Illinois, to keep low-level offenders out of prison,” added Clarke. “And we must work to ensure that those few youngsters removed from home are safe and receive the mental health counseling, education and other services that will give them an opportunity to mature into responsible adults.”

Two pieces of recently passed legislation awaiting Governor Quinn’s signature would do much to keep this comeback going and continue the positive trend of de-incarceration in the state by raising the juvenile jurisdiction age for felonies to 17 and allowing Cook County (which sends the largest number of kids to state juvenile prisons) to begin a Redeploy Illinois program in a section of the county, such as a specific police district or group of police districts. Redeploy Illinois provides funding for counseling and other direct services to young offenders, and participating counties agree in exchange to a 25 percent reduction in the number of juveniles committed to state prisons over a three year baseline. The program also ensures transparency and accountability through a statutorily required annual report and oversight board.

The development of this report was supported by the John D. and Catherine T. MacArthur Foundation through a grant to Public Interest Projects and other organizations committed to improving outcomes for kids and communities.

Maps: Rate of Change in Juvenile Arrests, 2009-2012

Posted June 4, 2013 by chiyouthjustice
Categories: Arrests, Chicago Police Department, Maps

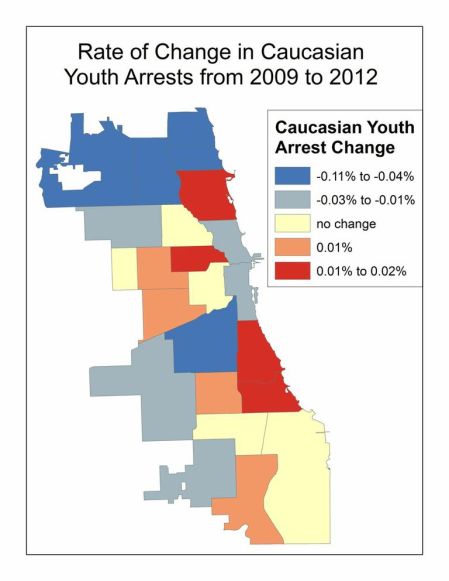
We are looking forward to releasing a new report about trends in Chicago juvenile arrests from 2009-2012 in the next few weeks. The report is written by students who were participants in an introductory GIS course taught by Dr. Mike Stiehl at Loyola University. The students are Ashley Cook, Zygmunt Czykieta, Paul Mack, and Chris Skrable and they created the following maps to illustrate the rate of change of juvenile arrests by district.  We have already shared information about the overall decline of 26.7% in juvenile arrests since 2009. Now we have these terrific maps to add more detail to the overall trend. We greatly appreciate our partnership with the students and are grateful for their important and excellent work.

(May 2013)

(May 2013)

The next three maps are broken out according the race (white, black, and latin@)

(May 2013)

(May 2013)

(May 2013)

(May 2013)

(May 2013)

(May 2013)